How wrong is your mortality projection model?
Pensions & benefits Mortality, longevity and demographic modelling Demographics
This was the question that I asked delegates when I presented at the nineteenth International Longevity Risk and Capital Markets Solutions Conference (“Longevity 19”) in Amsterdam in September.
I illustrated the significance of model risk by showing that the Projections Life Table produced by the Royal Dutch Actuarial Association produces forecasts which are materially different from the forecasts which result from applying a widely used alternative model to Dutch data.
In fact, so different are the projections that the value of the €20-30bn of Dutch pension fund liabilities expected to be bought out by insurers by 2027 could differ by at least €500 million depending on the model used.
All models are wrong, but some are useful.
George Box
The alternative model I used was the CMI Mortality Projections Model (“CMI model”) produced by the Continuous Mortality Investigation and which has widespread usage in the UK. Specifically, LCP took the latest version of the CMI model, “CMI_2023”, and calibrated it to Dutch data from 1983 to 2023. We compared the range of resulting projections with those obtained from the newly released Projections Life Table AG2024 (“AG2024”) and also its predecessor “AG2022”.
The explanation for the large difference between the projections is relatively simple.
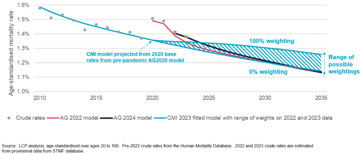
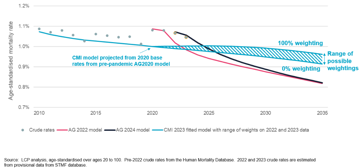
The AG2024 (and AG2022) projection assumes that excess mortality seen since the Covid-19 pandemic will run off very quickly, with annual improvements in mortality quickly reaching a long-term rate. This rate is based on the trends seen in selected European countries over the last five decades, and is much higher than the rate of improvements seen in the Netherlands since 2010.
Meanwhile, LCP's calibration of the CMI_2023 model assumes that the lacklustre improvements in mortality seen in the Netherlands since 2010 will continue in the near term, trending only slowly up to a higher long-term rate of improvement.
The impact of the different projections on life expectancies varies by age and sex, and also depending on how much weight is placed on post-pandemic data when using the CMI model.
The difference between the models is particularly pronounced for females, as illustrated in the chart and table below.
Projections of mortality rates
Comparison of projected mortality rates - Males

Comparison of projected mortality rates - Females

|
Cohort life expectancy (years) in 2024 |
AG2024 model |
CMI_2023 (no weight on 2022/23 data) |
CMI_2023 (full weight on 2022/23 data) |
|
Male; Age 65 |
20.5 |
-1.4% |
-4.9% |
|
Male; Age 80 |
8.7 |
+1.7% |
-2.1% |
|
Female; Age 65 |
23.3 |
-5.3% |
-6.7% |
|
Female; Age 80 |
10.2 |
-2.8% |
-4.9% |
These life expectancy differences are a great illustration of model risk. The differences between the two models are far larger than the differences recently seen between successive versions of either the AG model (cohort life expectancies fell by 0.1% for males and 0.2% for females between AG2022 and AG2024) or the CMI model (cohort life expectancies at age 65 fell by 0.4% for males and 0.2% for females between CMI_2022 and CMI_2023).
With models from two well-respected actuarial bodies producing such different mortality projections, how should Dutch pension funds, and the insurers and reinsurers active in the growing pension risk transfer market, set mortality assumptions?
Solely relying on traditional actuarial methods to predict future mortality trends no longer works. Instead, LCP’s approach draws from our multi-disciplinary team of actuaries, health professionals, epidemiologists and public health experts to provide insights on what is driving changes to mortality and provide informed forward-looking scenarios.
We recently ran a structured Delphi process to obtain insights into how mortality rates in the UK are likely to progress over the next decade. We are currently running a similar exercise for the Netherlands with a panel of experts including several Dutch experts and will have results available later in 2024.
To find out more about our insights into future mortality in the UK or the Netherlands and how we can help you with assumption setting please contact me directly or speak to another member of LCP’s mortality team.


