The PRA’s recent “Dear CRO” letter highlighted two areas of concern for reserving:
- Bias in reserve estimates (over-focus on favourable claims development potential, despite evidence of worsening incurred claims experience).
- Possible weakening in case reserve estimates.
To address these concerns the PRA is expecting firms to:
- Provide evidence of the risk function’s involvement in challenging reserving teams.
- Ensure that the Board is suitably well-informed about the uncertainty these issues give rise to before it sets the reserves.
Meeting the PRA’s expectations
CROs can provide effective reserving challenge using a few simple metrics, including those presented in the PRA’s “Dear CRO” letter. These provide a fresh perspective on the reserving, are easy to produce, and avoid repeating work that has already been done by the reserving team.
These metrics can be reported to the Board to ensure they are well-informed on important reserving issues and well prepared for regulator queries.
Development charts are the natural metrics to look at for reserving. However, as noted in this post, whilst they are the bread and butter of reserving, they are not always discussed with the Board.
In the rest of this blog we look in more detail at the metrics used in the “Dear CRO” letter, present our analysis of these metrics using a recent London Market dataset, and discuss additional metrics that you can use to enhance your own reserving processes.
Metrics used in the “Dear CRO” letter
The PRA’s concerns of bias in reserve estimates and possible weakening in case reserving estimates were supported by the analysis of three key development charts:
- Incurred claims triangle as a proportion of the incurred at year 1 – where fanning out of the development for 2015 and post indicated adverse reported experience for the most recent years.
- Paid claims triangle as a proportion of the incurred claims triangle – where an increase in this metric for recent years indicated a potential weakening of case reserves of outstanding claims.
- Incurred claims triangle as a proportion of the ultimates set at each year – where an increase to this metric over 2016-2019 indicated a weakening of reserving assumptions, given the results of 1) above.
Embedding these metrics effectively
We believe that all firms should be looking at these three development charts at a minimum. This analysis could be done as part of the main reserving process or carried out by the risk team to give a fully independent view on the appropriateness of the reserves, without repeating the work done by the core reserving team.
To be best prepared for regulatory queries, firms should view these charts from the regulator’s perspective - at the whole company level and aggregated by Solvency II line of business, as well as the classes used for reserving.
Analysis of a recent London Market dataset using LCP InsurSight
Identifying trends in development charts and being able to easily slice and dice these across different aggregations are two of the key features of our reserving analytics tool, LCP InsurSight, which is currently being used by insurers to assess over £70bn of reserves.
We have used LCP InsurSight to replicate the analysis of metrics 1 and 2 from the “Dear CRO” letter for a recent London Market dataset. We did this to understand:
- which parts of the London Market are most affected by the issues identified by the PRA;
- to what extent the issues identified in the PRA’s analysis using Solvency II reporting at year-end 2019 are present in a more recent dataset.
- the effect of only looking at London Market companies all reporting on an underwriting year basis, rather than a mix of companies reporting on accident year and underwriting year bases.
A key feature of LCP InsurSight is that it uses machine learning to automatically identify and highlight key potential areas of concern. The in-built algorithms then prioritise these, and present them in a dashboard ready for review.
Deteriorating incurred claims experience for recent underwriting years

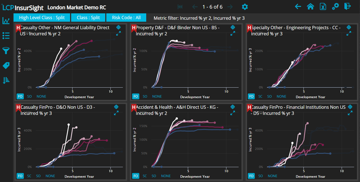
These charts show the incurred triangle as % of development year 2 and 3 incurred. This is similar to the chart shown in the Dear CRO letter, but using development year 2 and 3 instead of development year 1. This is because London Market classes are typically at a very early stage of development at development year 1.
Of the six classes automatically identified by LCP InsurSight as having the strongest evidence of deteriorating incurred claims experience, two relate to financial lines (D&O Non US (D3) and Financial Institutions Non US (D5)), consistent with the “Dear CRO” letter. However, General Liability Direct US, Property D&F Binder Non-US (B5), Engineering Projects (CC), and A&H Direct US (KG) have also been highlighted as areas of concern.
Possible weakening in case reserve estimates

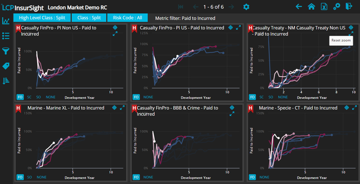
Of the six classes identified by LCP InsurSight as having the strongest evidence of increasing fanning out in paid to incurred ratios, three relate to financial lines (PI Non US, PI US and Bankers’ Blanket Bonds & Crime), again consistent with the “Dear CRO” letter. However, Casualty Treaty Non-US, Marine XL, and Specie (CT) have also been automatically highlighted as areas for concern.
What other metrics can increase understanding and confidence in the reserving process?
In addition to the three metrics mentioned by the PRA, we have identified a number of other metrics that are useful to help you better understand the underlying causes of emerging issues. Many of these don’t require any additional data and, by considering things from alternative angles, provide more confidence that the reserves are appropriate.
Three additional development charts that we find particularly useful are:
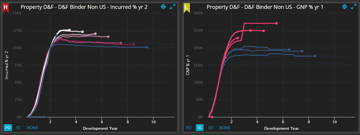
- Signed premium triangle as a % of premium signed at development year 1 – where fanning in/out suggests faster/slower premium development, which in turn can help explain changes in the speed of incurred claims development, as shown below for Property D&F Binder Non-US.

This metric can also be used more proactively by the reserving team to pre-empt changes in incurred development on more recent years of account, and so provide more accurate information to management on the performance of recent years of account.
- Paid claims triangle as a % of selected ultimates – which is similar to metric 3 above but using paid instead of incurred claims. This metric allows you to assess if the paid development suggests bias in the reserves without doing lots of work to do separate paid projections of the reserves.
- Ultimate triangle as a % of ultimates at year 1. This provides a longer term view on the appropriateness of the reserving. In particular, to highlight where the reserving team has been slow to identify worsening claims experience, or where initial expected assumptions have been overly optimistic.
Conclusion
A few simple metrics can help your risk team provide effective challenge to the reserving process and ensure that the Board is well-informed on important reserving issues.
LCP InsurSight makes it easy to analyse these metrics and is currently being used by insurers to assess over £70bn of reserves. Click here for more information and get in contact with me or InsurSight.Helpdesk@lcp.uk.com to arrange a demo or proof of concept.

