A strong start to 2022 for UK pension risk transfer
Pensions & benefits Pension risk transfer DB pensions Risk
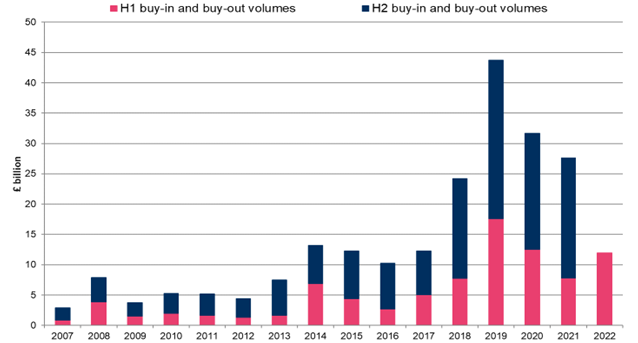
Analysis of insurers’ H1 2022 results by Lane Clark & Peacock (LCP) shows that the UK pension risk transfer market has started strongly in 2022 with £12.0bn of buy-ins and buy-outs. This is an increase of over 50% compared to H1 2021 (£7.8bn) and is the third largest first half ever.
LCP’s analysis is based on the insurers’ final reported results for H1 2022 that have been published in the past few days. Key findings include:
- Competition for buy-ins/outs remains fierce. The five insurers who led 2021 have continued to be successful with Aviva, Legal and General (L&G), Pension Insurance Corporation (PIC), Rothesay and Standard Life all writing over £1bn of buy-ins/outs in H1 2022.
- L&G wrote the highest buy-in/out volumes with £3.7bn (31% market share). PIC was next with £2.4bn (20% market share), a big increase on their H1 2021 volumes of £0.4bn. Next came Aviva and Standard Life who wrote £1.9bn (16% market share) and £1.6bn (14% market share) respectively. Rothesay wrote £1.0bn (8% market share). Full figures are set out at the end of the release.
- The other three insurers (Just, Canada Life and Scottish Widows) all wrote more than in H1 2021, with total volumes of £1.3bn in H1 2022 across the three of them.
- The largest buy-in/out in H1 2022 was the £2.3bn follow-on pensioner buy-in by the British Steel Pension Scheme with L&G. The next largest was the £1.1bn full buy-in by the EDS 1994 pension scheme with PIC. A £1.0bn full buy-in was completed by WH Smith with Standard Life since the end of June. There were five other transactions over £500m in H1 2022 including by the House of Fraser scheme, the TI Group scheme and the Whitbread scheme.
- The make-up of the market remained very similar to 2021 with mid-sized buy-ins/outs (between £100m – £1bn) making up c30% of transactions in H1 2022 (2021: c33%) and sub-£100m transactions at c67% of transactions in H1 2022 (2021: c63%).
- A £5.5bn longevity swap for the Lloyds Bank scheme was announced in early 2022. This compares to 3 longevity swaps totalling £12.7bn announced in H1 2021.
Full data is set out in the notes to editors section below.
Charlie Finch, partner at LCP, commented: “Buy-in and buy-out activity has continued strongly into 2022 with volumes increasing by over 50% in the first half of the year compared to 2021. Activity has been ramping up over the second half and we expect to increase further in 2023.
“The activity has been driven by surging pension scheme funding positions on the back of the biggest rise in long-term interest rates this century (20-year gilt yields have more than trebled to 3.7% pa since the start of the year). We expect this to turbo-charge demand from pension schemes looking to de-risk next year. The challenge is that insurers simply do not have the resources to quote on all of the opportunities that could come to market. The schemes that win will be those who have invested in preparation across cleaning data, drawing up detailed benefit specifications, getting their investments transaction ready and putting in place suitable governance arrangements with the sponsor. Such preparation will pay dividends over the coming years.”
-ENDS-
Buy-in/ buy-out volumes in the UK by insurer:
|
Insurer |
H1 2022 (£bn) |
H1 2022 share |
H1 2021 (£bn) |
H2 2021 (£bn) |
Total 2021 (£bn) |
2021 share (rank) |
|
1. Legal & General |
3.7 |
31% |
2.0 |
3.3 |
5.3 |
19% (3) |
|
2. PIC |
2.4 |
20% |
0.4 |
4.3 |
4.7 |
17% (4) |
|
3. Aviva |
1.9 |
15% |
1.6 |
4.5 |
6.2 |
22% (1) |
|
4. Standard Life |
1.6 |
14% |
1.4 |
4.0 |
5.5 |
20% (2) |
|
5. Rothesay |
1.0 |
8% |
1.6 |
1.4 |
3.0 |
11% (5) |
|
6. Just |
0.6 |
5% |
0.5 |
1.4 |
1.9 |
7% (6) |
|
7. Scottish Widows |
0.4 |
4% |
0.1 |
0.0 |
0.1 |
0% (8) |
|
8. Canada Life |
0.3 |
3% |
0.1 |
1.0 |
1.0 |
4% (7) |
|
Total |
12.0 |
100% |
7.7 |
19.9 |
27.7 |
100% |
Source: Insurance company data. Only buy-ins and buy-out with a UK pension scheme are included. The data therefore excludes the APP transactions by L&G (£925m in June 2021). Note the totals may not sum due to rounding.
The chart and table below set out the volume of buy-ins and buy-outs each year since 2007.

Source: Insurance company data
|
£bn |
2007 |
2008 |
2009 |
2010 |
2011 |
2012 |
2013 |
2014 |
2015 |
2016 |
2017 |
2018 |
2019 |
2020 |
2021 |
H1 2022 |
|
Buy-ins/outs H1 |
0.9 |
3.9 |
1.5 |
2.0 |
1.7 |
1.3 |
1.7 |
6.9 |
4.4 |
2.7 |
5.1 |
7.8 |
17.6 |
12.6 |
7.7 |
12.0 |
|
Buy-ins/outs H2 |
2.1 |
4.0 |
2.2 |
3.3 |
3.6 |
3.1 |
5.8 |
6.3 |
7.9 |
7.5 |
7.2 |
16.5 |
26.2 |
19.1 |
19.9 |
n/a |
|
Longevity swaps |
n/a |
n/a |
3.8 |
4.3 |
7.1 |
2.2 |
8.8 |
21.9 |
9.4 |
2.6 |
6.4 |
c5 |
7.8 |
24.1 |
15.3 |
5.5 |
Previous data can be found in LCP’s De-risking Report 2021, “Finding a safe landing” available at: https://indd.adobe.com/view/4ad93a21-4f5c-404a-b1ed-529dc1566c19.
